
Dynamic spending: A better way to budget in retirement
Financial markets are unpredictable—they can bring tremendous gains one day and post painful declines the next. If you’re close to retirement or already retired, this can pose a significant concern—but it doesn’t have to.
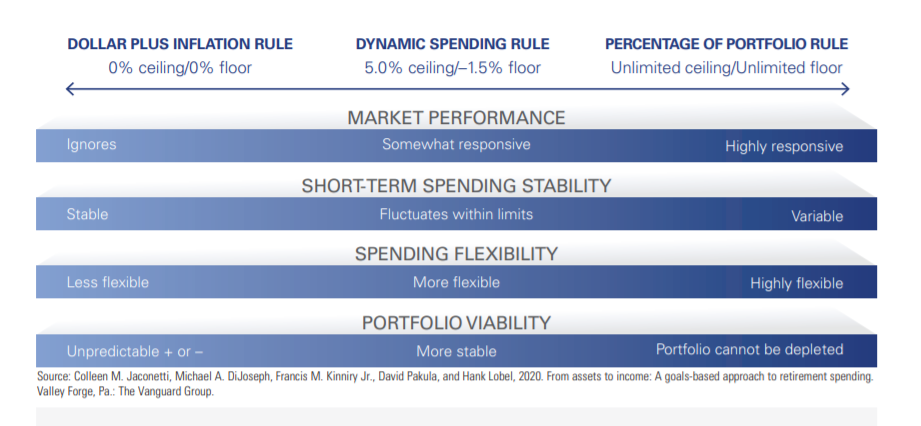
Investors use a number of methods to figure out how much they can spend in retirement, but one, in particular, stands out: a dynamic spending approach. Dynamic means it’s flexible—by making minor changes to your spending in any given year in response to the markets’ performance, you can help sustain your portfolio during market downturns (while sacrificing little) and have more to spend following high-performing years.
How the dynamic spending rule works
Determine each year's spending by taking a percentage of your portfolio balance from the previous year. For example, if your portfolio totals $1 million and you need$40,000 a year in income, you'd start by taking 4% of your portfolio in Year 1.
Calculate dynamic spending limits-a ceiling and a floor-by applying appropriate percentages to the prior year's spending amount, adjusted for inflation. The example below uses a 5% ceiling and a 2.5% floor. With a 3% rate of inflation, the ceiling and floor would be calculated as $42,000 and $39,000, respectively. The percentage of portfolio amount, after accounting for investment gains and the prior year's spending, would be $42,400.
Compare the results. If the newly calculated spending amount exceeds the ceiling, limit spending to the ceiling amount. If the calculated amount is below the floor, increase spending to the floor amount. In the example, since the $42,400 percentage of portfolio amount exceeds the ceiling of $42,000, spending would be constrained to the ceiling.
This rule helps maintain income for basic expenses while allowing for more discretionary income if market returns are favorable.
Portfolio balance at retirement: $1,000,000

Assumptions used in this example

Notes: This illustration does not represent the investment results of any particular portfolio. The figure shows a hypothetical three-year example of a spending strategy using the "percentage of portfolio with ceiling and floor" method. Here, the Year 2 spending amount is constrained by the ceiling rule, while Year 3's spending amount is constrained by neither the ceiling nor the floor. The blue lines emphasize which of the three calculated amounts should be used as each year's spending withdrawal. Source: From assets to income: A goals-based approach to retirement spending. (Jaconetti, DiJoseph, Kinniry Jr.,Pakula, and Lobel, 2020.)
Notes: Please remember that all investments involve some risk. Be aware that fluctuations in the financial markets and other factors may cause declines in the value of your account. There is no guarantee that any particular asset allocation or mix of funds will meet your investment objectives or provide you with a given level of income.