
200 Years of Interest Rates in the U.S.
Visualize the the history of U.S. interest rates over two centuries, from the creation of the first U.S. Bank to the current historic lows.
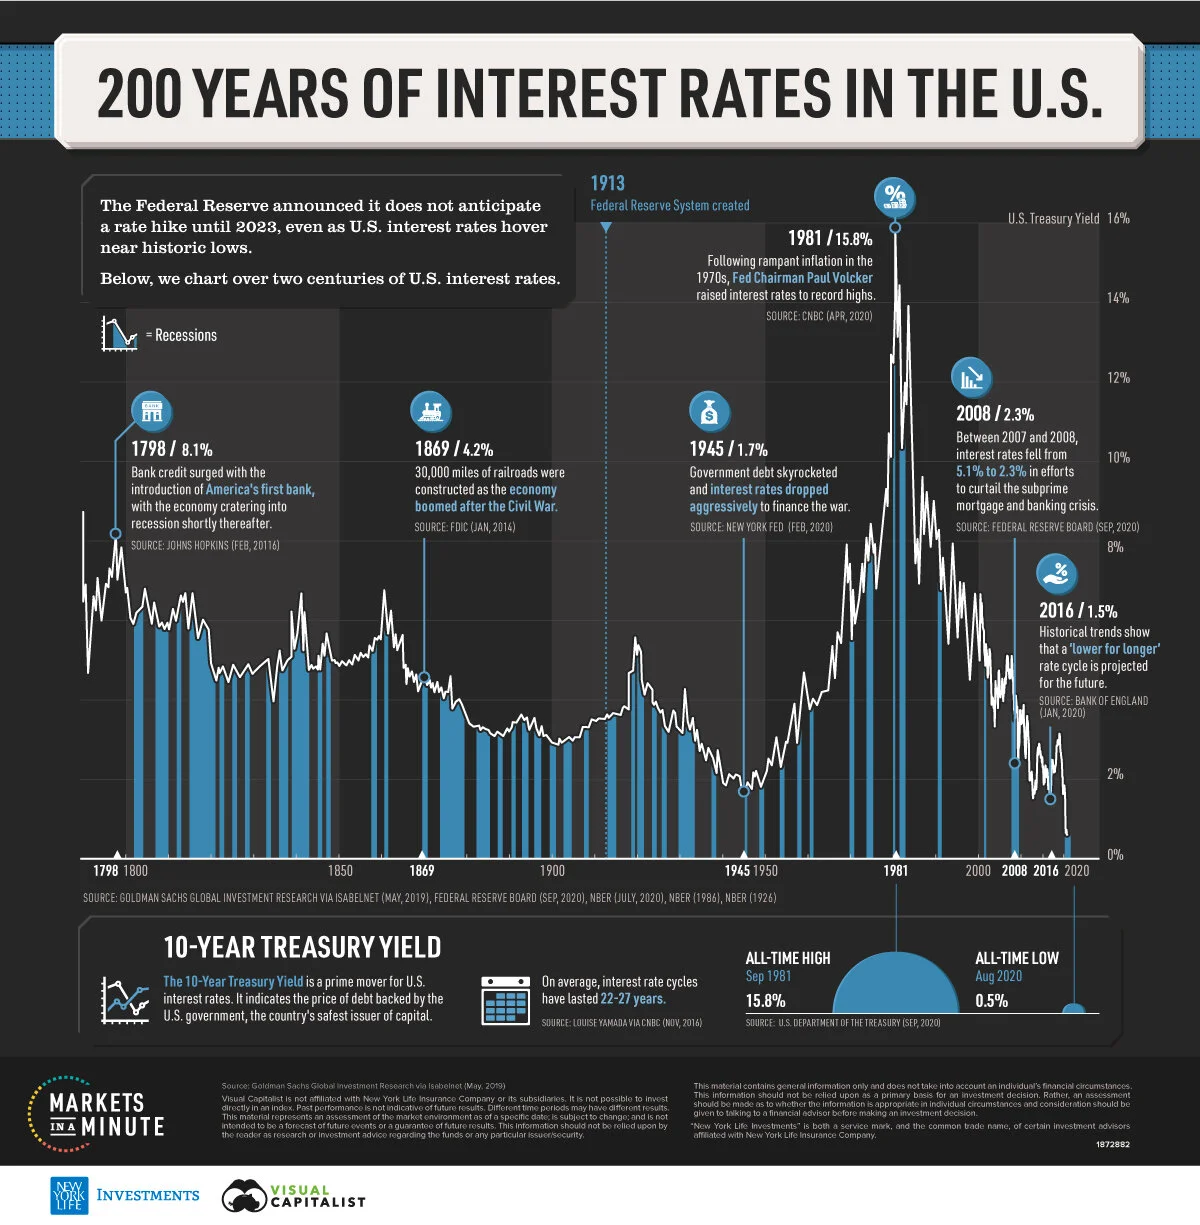
Visualizing the 200 Year History of U.S. Interest Rates
U.S. interest rates will stay near zero for at least three years as the Federal Reserve enacts measures to prop up the economy.
But are low interest rates a new phenomenon? Interestingly, one study by the Bank of England shows that this pattern of declining interest rates has taken place globally since the late Middle Ages. In fact, it suggests that these downward-sloping rate trends have taken place even before modern central banks entered the scene—illustrating an entrenched, historical trend.
This Markets in a Minute chart from New York Life Investments tracks the history of U.S. interest rates over two centuries, from the creation of the first U.S. Bank to the current historic lows.
U.S. Interest Rates: Historic Highs and Lows
What are the highest and lowest rates throughout history?
Prior to today’s historically low levels, interest rates fell to 1.7% during World War II as the U.S. government injected billions into the economy to help finance the war. Around the same time, government debt ballooned to over 100% of GDP.
Fast-forward to 1981, when interest rates hit all-time highs of 15.8%. Rampant inflation was the key economic issue in the 1970s and early 1980s, and Federal Reserve Chairman Paul Volcker instigated rate controls to restrain demand. It was a period of low economic growth and rising unemployment, with jobless figures as high as 8%.Emotional Distress Levels, by Demographic Group
Findings uncovered that almost 40% of participants have lost their jobs, or experienced a reduction in income due to the COVID-19 outbreak. However, the reverberations of such stressors vary by demographic subgroup.

*Indicated by 10-Year Treasury Yields, a prime mover of interest rates
**As of September 28, 2020
Source: Macrotrends
Over the last year, interest rates have dropped from 2.1% to 0.9%, a 65% decrease. Rates are now below 1945 levels—and well under 6.1%, the average U.S. interest rate over the last 58 years.
Longer Horizons
Interest rates in the 18th and 19th centuries also provide illuminating trends.
After falling for three decades at the turn of the century, interest rates stood at 4% in 1835. That year, president Andrew Jackson paid off the U.S. national debt for the first and only time in history, as debt was seen as a “moral failing” or “black magic” in his eyes.
One consequence of this was the government sold swaths of land to finance the federal budget, ultimately avoiding the accumulation of debt. It didn’t last for long. The influx of land sales led to a real estate bubble and eventually, the economy fell into a recession. The government had to borrow again and rates ticked higher over the next several years.
Similarly, after the Civil War ended in 1865, data shows that interest rates also witnessed a long-term, negative slope, which ended in 1945. It then took 100 years for interest rates to exceed the highs of the Civil War era.
Why So Low For So Long?
While the exact reasons are unclear, broad structural forces may be influencing interest rates.
One explanation suggests that higher capital accumulation could be a factor. Another suggests that modern welfare states, with their increased public spending, have as well. For instance, average expenditures of total GDP in the UK averaged 35% between 1981 and 1960, compared to 8% between 1700 and 1750.
Along with this, rates usually have cycles that last between 22 and 27 years. When cycles shift from rising to falling rates, a quick reversal typically takes place. This was seen in 1982, when interest rates dropped 25%—from 14.2% to 10.4%—in one year. However, a different trend can be seen when falling rates switch to rising trends. These reversals typically average 2-14 years.
As near-zero rates seem more likely for the extended future, market distortions—such as ultra-low income yields—may become more commonplace. In turn, investors may want to rethink traditional asset allocations between fixed income, equities, and alternatives.